Overview of the London Commercial Property Market 1st Quarter 2017

Sustained rental value growth has been the predominant theme in the London commercial property market during the first quarter of the year. On the whole, Q1 2017 can be described as positive and with no significant changes with regards to the previous quarter.


London
Office Market Q1 2017

Take-up rates in Central London doubled in Q1, reaching 1 million square feet in February. These were particularly high in Southbank, where vacancy rates dropped to their lowest point in the past 18 months, reaching 3.3 per cent. Central London take-up by sector remains unchanged, with media and tech occupiers on the lead, followed by the public sector, finance, and business services. Grade A vacancy rates ranged between null values in Aldgate to 15 per cent in Holborn.

Total availability increased by 4 per cent to 14.7 million square feet, although most supply is clustered around King’s Cross, Paddington, Stratford, and London Bridge.

Rental values grew by 0.2 per cent across the city. The lowest average rents are currently £40 / sq ft in Stratford and £47.50 in the Docklands, whereas the highest are in St James and Mayfair (£110 / sq ft), Soho, Belgravia, and Knightsbridge, ranging from £85 to £87.50.

However, the introduction of higher business rates in April may reverse the generalised upward trend. This will be most evident in the legal sector, which has also been affected by increases in annual rent costs, reaching 5 per cent over a five-year period. The business rates revaluation may lead to a decreased enquiry volume in sub-markets affected by the sharpest increases, namely Clerkenwell, Camden, Shoreditch, King’s Cross, and West City. Continue reading “Overview of the London Commercial Property Market 1st Quarter 2017”

How to Look Clever at Work

How to Look Clever at Work from LondonOfficeSpace.comIf you sometimes feel overwhelmed during meetings, terrified during presentations, and just a little bit slow during your day-to-day interactions at work, there are ways for you to appear smarter. Using a little science and a lot of research, the sociology world has found ways for you to look smarter at work.

Keep Your Language Simple
Think back to the last time you read an email that was laced with hyperbole. The chances are, you found it irritating rather than impressive. A study conducted by Princeton University in 2005 found that those who use grandiose language don’t appear smarter than their contemporaries who keep things simple. In fact, quite the opposite happens. According to the study, when you use overly complicated language, you disrupt the fluency of the overall conversation. Using language that you’re familiar with, and that others will understand, is far more effective.Smile to Look Intelligent
A study published in PLoS in 2014 found that walking around with a frown on your face will cause others to believe you are of low intelligence. In contrast, being smiley will lead them to believe you are smart. This study investigated the traits found in ‘high intelligence’ and ‘low intelligence’ faces. The majority of faces associated with high intelligence carried expressions of joy, and were often friendly. If you usually walk into work with a glum expression, take a little time to put a smile on your face.Be Self Assured and Use Expressive Speech
A meta analysis carried out by Northeastern University found that those who appear self assured and use expressive speech are perceived as being more intelligent than those who do not. Expressive speech involves varying degrees of tone, with passion and no faltering. In other words, you need to be confident in what you say and how you say it. Clearly this doesn’t come naturally to everyone, and shyness or a lack of confidence in what you are saying doesn’t always correlate with low intelligence. If you struggle with public speaking or speaking up in meetings, focus on those topics you feel confident speaking about and take some time to practice talking to yourself at home. It can work wonders for your expressive speech skills.
Continue reading “How to Look Clever at Work”

Considering a Move to the Award Winning Chiswick Business Park?

Chiswick Business Park is an award-winning commercial property development that offers first-class office and retail space along with multiple leisure amenities. This development has received numerous awards since 2001, the most notable of which include the 2002 British Construction Industry Award, the 2003 RIBA Award, the 2011 Best Business Award for Best Customer Focus, the 2012 Financial Times Top 50 Workplaces in the UK, the 2013 Queen’s Award for Enterprise and Sustainable Development, and the 2016 Green Apple Award.

Currently, the park consists of 11 buildings that occupy nearly 1.5 million square feet, although further development is expected given that the park’s developers have planning consent to build a total of 1.8 million square feet. Some of the features that characterise the space available at the park include floor-to-ceiling heights of 9.8 feet, open plan floor plates, VAV and air displacement heating and air conditioning systems, ample parking space, smart building automation and monitoring systems, and CCTV. Moreover, the park is known for its commitment to green practices, evident in the presence of sustainable washrooms and the recycling of food, green waste, and rainwater.

Amenities

This business park offers a wide range of amenities in addition to state-of-the-art commercial property space, including on-site coffee shops, restaurants, bars, and shops. On the leisure front, tenants have access to a Virgin Active fitness club, landscaped outdoor areas suitable for pedestrians and cyclists, dedicated outdoor space for corporate events, and annual sports events organised by the companies headquartered here. A miniature golf course is 1.6 miles away, and the park is only a few minutes’ walk from the Gunnersbury Triangle Nature Reserve, which provides tenants with opportunities to unwind in a pleasant natural environment. Continue reading “Considering a Move to the Award Winning Chiswick Business Park?”

London’s Ever-Changing Skyline And Its Implications For The Office Rental Market

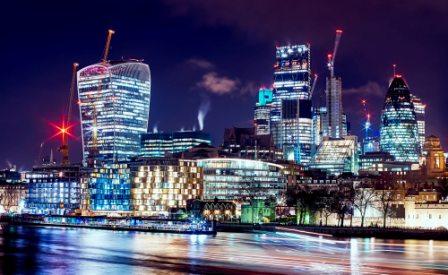
London’s skyline and its blend of traditional and modern architecture is certainly representative of the city’s special relationship with its past and future. One of the most distinctive traits of the city’s skyline is its surprisingly low number of high rises, especially when compared to other global cities with a large population and high levels of economic activity. Makeover plans were put on hold or abandoned altogether during the financial crisis, and in other cases they were met with opposition from residents and consumer groups. But recently, an impressive number of development plans have received the go ahead, and in early 2017 there were 119 high rises in the city’s development pipeline. Submissions for planning permission increased by 30 per cent in just one year, and many affirm that the city’s skyline will the fully transformed by 2025.

Which Areas Are More Likely To Be Transformed?

London’s vertical transformation will be most evident in the City and East London. Tower Hamlets will be thoroughly transformed, as there are 93 high rises in the borough’s development pipeline. This area will be home to the city’s tallest skyscraper, once the 75-storey Landmark Pinnacle is completed. Moreover, the construction of the impressive Bishopsgate 22 and 1 Undershaft may make the Gherkin invisible, and similar developments are planned in Isle of Dogs (with the 45-storey Baltimore Tower), the EC3 postcode (with the Scalpel Tower, 100 Bishopsgate, and 60-70 St Mary Axe).

The city’s skyline will also bring a new visual identity to areas outside the city core. Shoreditch will consolidate itself as a major business district with developments like Bishopsgate Goodsyard, Principal Tower, and the Stage. Southwark will have 26 new high rises, and Lambeth and Newham will not be left behind with 32 each. Other areas whose skyline is likely to change include Croydon, Barnet, and even West London, particularly in Chelsea, Hammersmith and Fulham. Continue reading “London’s Ever-Changing Skyline And Its Implications For The Office Rental Market”

Overview of the London Commercial Property Market in 2016

During the last quarter of 2016, and much in line with the rest of the year, a cautious approach has been the predominant theme in London’s commercial property market. Broadly speaking, the market saw a consolidation of the trends that were evidenced earlier in the year, namely weak occupier demand (particularly in the office sector), moderate rental growth levels, and a surge in the number of occupiers looking for flexible lease terms.

Office Market

Political uncertainty and fluctuations in the value of the pound caused a slow-down of the office market during Q4. However, while take-up rates were down when compared to the long-term average, they noticeably picked up towards the end of the year. With regards to the causes behind this slow-down, market analysts at Green Street Advisors have drawn attention to factors other than the current political climate. For instance, the implementation of advanced technologies and automation is expected to have far-reaching effects in industry fields that are considered major office occupiers, ranging from finance to customer service.

The main office market indicators behind end-of-year data showed that Grade A absorption and take-up rates were down when compared to the city’s 10-year average. At the same time, availability rates for office properties across the city increased, and rental values remained stable. Market indicators for West End office units followed this pattern with the exception of rental rates, which evidence a slight decrease of 5.2 per cent, mainly in Marylebone, Knightsbridge, and Bloomsbury. In other parts of the West End, rental values remained stable thanks to a combination of flexible incentive packages and low vacancy rates. The highest rental rates were in Mayfair and St James’ (£118 / sq ft), whereas the lowest were in Paddington and Bloomsbury (£67.50 and £68.50 respectively). Vacancy rates were at their highest in St James’ (close to 10 per cent), Paddington and Bloomsbury (6 per cent). Key occupiers were business services, media, tech, and finance. Continue reading “Overview of the London Commercial Property Market in 2016”

City in the East – London Plan

In October 2015, the mayor of London unveiled his office’s development plan for several neighbourhoods in East London and to the south of the River Thames. This initiative is part of the London Plan, an ambitious project that was initially presented to the general public in 2004. The main objective behind the new City in the East plan is to promote the socio-economic development of designated Opportunity Areas within the British capital.

Below is a detailed description of the plan and the benefits that it will bring to local residents once completed.

City in the East: An Overview

The City in the East Plan is a collaborative project that will bring together the Greater London Authority, local borough councils, Transport for London, and a number of stakeholders from both the public and private sectors. The plan aims to consolidate and build on previous urban development projects, such as Thames Gateway.

City in the East will focus on the creation of employment and on the development of quality housing by capitalising on the large amounts of brownfield land available in this part of the city, and by transforming it into mixed-use developments. Overall, it is expected that the implementation of this plan will benefit approximately 600,000 Londoners and will result in the creation of 280,000 jobs and 200,000 homes. At the same time, the City in the East plan will help prepare the UK’s capital city infrastructure for future demographic growth, as it is expected that London’s population will increase by nearly 2.5 million by 2050.

Opportunity Areas and Housing Zones

The City in the East plan will affect a total of 27 Opportunity Areas and Housing Zones.

The largest area is Olympic Legacy, where 32,000 new housing units and 50,000 jobs are to be created. This Opportunity Area covers Olympic Park, the northern and southern Olympic Fringes, Hackney Wick, Fish Island, and Stratford. Approximately 1.3 million square metres of commercial space will also be built in this Opportunity Area. Continue reading “City in the East – London Plan”

City in the West – London Plan

In the autumn of 2015, the former mayor of London Boris Johnson announced an ambitious urban development plan for the British capital. The project (which in fact consists of two different but interrelated plans known as City in the East and City in the West) aims to create a more balanced distribution of economic and commercial power within the UK’s capital city.

Over the past decade, development plans in West London have been somehow overlooked, since most of the work has been directed at transforming East London and getting this area ready for the Olympics. The City in the West Plan was created to address this situation and to help tap into the potential of West London and turn it into one of the most desirable places to live and work.

City in the West: Overview and Key Figures

City in the West is a joint initiative supported by the Greater London Authority, Transport for London, local councils in west and south west London, and various public and private sector investors. One of the key objectives of the City in the West plan is to consolidate a number of local planning and development projects, such as the Western Wedge or the Western Access Corridor. Other important objectives include the delivery of substantial infrastructure improvements, the creation of jobs, and the construction of quality and affordable housing.

This plan could be considered as an ambitious extension of the London Plan. Whereas the 2004 London Plan contemplated the creation of 150,000 jobs in West London, the new plan sets its estimates at 300,000 jobs. Housing creation estimates have also been re-evaluated, going from 30,000 homes according to the 2004 plan to approximately 210,000. All in all, the Greater London Authority expects that more than 600,000 Londoners will directly or indirectly benefit from the new developments brought about by this plan.

Locations and Scope

The City in the West plan will be implemented across several Opportunity and Intensification Areas. Housing Zones have also been designated in boroughs located to the west and south west of central London. Key locations include: Continue reading “City in the West – London Plan”

Overview of the London Commercial Property Market – 3rd Quarter 2016

London Office Space Market

Q2 2016 ended on a note of uncertainty due to the unexpected result of the Brexit vote. Researchers suggest that the vote had a direct effect on the activity levels of the London office market, although the effects were far from dramatic given that most of the transactions in the local market consisted of pre-lets deals that had been completed before the referendum. On the whole, the third quarter of 2016 has been characterised by the ongoing decrease in the availability of Grade A space. Citywide, vacancy rates are considerably lower than the decade’s average at just over 4 per cent. The only office sub-markets where availability levels are above 5 per cent are Clerkenwell, Holborn, and St James. By the end of the year, it is expected that approximately 4.6 million square feet will be delivered across London, which may bring a temporary relief to the tight supply-demand ratio (1).

Following the Brexit vote most investors have taken a cautious approach, as they have decided to put decisions on hold to evaluate how current market conditions will play out in the short and medium term. As a result, there have been no changes in yields when compared to the previous quarter, staying at around 4 per cent citywide and 3.25 per cent in the West End (2). However, some have suggested that further investments may be hindered in the near future based on the evolution of UK-EU relations, as it may become harder for investors to borrow funds and obtain credit and this could lead to a drop in overall investment volume (3).

During Q3, prime office rents have remained mostly unchanged in the majority of office sub-markets, averaging £70 / square foot in the City and £125 / sq ft in the West End. The priciest rental values could be found in Mayfair, St James, Marylebone, Knightsbridge, whereas the lowest apply to properties in the Docklands, Chiswick, Aldgate, and Shoreditch. On the whole, rental growth is expected to flatten until the end of the year, although demand may tighten up in areas like Fitzrovia, Soho, Noho, and the City, where total occupational costs are likely to reach £114 / square foot by 2018. In fact, the only sub-markets where total occupational costs may remain below the £100 / sq ft mark are Aldgate and Canary Wharf. The biggest rental value fluctuations on a year-on-year basis apply to office properties in Canary Wharf, the Eastern City Fringe, Hammersmith, and King’s Cross (4).

The most notable deals within the office market involved properties in Canada Square, Cannon Street, Holborn, King’s Cross, and Victoria. Take-up volume was at its highest in the City, with 43 per cent of the total, followed by the West End (27 per cent), Docklands (12 per cent), Midtown (11 per cent), and to a lesser extent, in Southbank and Hammersmith (5).

London Retail Market

According to some market analysts, the depreciation of sterling with respect to the euro and other foreign currencies has been somehow beneficial to the retail sector in London, and especially in central London due to the area’s traditionally high tourist footfall levels. During the third quarter of the year, there has been a surge in expenditure in shops, restaurants, and hotels, partly due to the onset of the summer season (6). West End retailers have been largely unaffected by the Brexit vote, as more than 60 per cent of all shoppers in this area are international visitors, although it is still unclear how domestic consumer confidence will be affected in 2017 and beyond (7).

During the month of August, prime retail rent records were broken following the deal signed by Spanish retailer Desigual for a property in Oxford Street. This transaction’s value reached £1.5 million (or £700 / sq ft / year), a figure that is significantly higher than the area’s average at £575 / sq ft / year (8). Luxury retail locations within Central London remain attractive to foreign investors. The most important retail deal of this quarter involved the sale of a 50,000 square feet building in New Bond Street for nearly £200 million (9).

Investment yields for retail properties remain stable, ranging between 4 and 5 per cent for prime retail and shopping centre properties (10).

Industrial Market

Throughout Q3, the industrial property sub-market within the Inner M25 continued to perform strongly, mainly due to robust demand and limited supply of standard industrial properties and distribution warehouses. The main industrial property hotspots are near Heathrow and in parts of Greater London like Croydon, where multi-let and big box units continue to be in high demand thanks to the strong performance of the e-commerce sector. Average prime rents for industrial properties in industrial parks near Heathrow reached £14 / square foot / year, which represents an increase of nearly 8 per cent over last year’s figures. In Croydon, rental rates for standard industrial properties average £11 / square foot / year, and in the rest of Greater London prices remain stable or have only experienced modest increases.

Market analysts predict that in the short term, rising investment returns are likely to turn the industrial sector into the best performing of all sub-markets. According to the forecast, yields for industrial properties within the M25 may exceed 7 per cent by 2020, as many of them are already returning yields of nearly 6 per cent. It is also expected that sterling devaluation will result in the growth of export manufacturing activities, which in turn will have a direct impact on the local industrial property market (11).

Sources:

(1) http://www.cbre.co.uk/uk-en/research

(2) http://www.cushmanwakefield.co.uk/en-gb/research-and-insight/uk/united-kingdom-office-snapshot/

(3) http://www.savills.co.uk/research_articles/173552/205429-0

(4) http://www.colliers.com/-/media/files/emea/uk/research/offices/201605_londontechmarketmonitor.pdf?la=en-GB

(5) http://www.cluttons.com/sites/default/files/documents/london-office-market-bulletin-summer-2016.pdf

(6) https://www.theguardian.com/business/2016/sep/23/spending-by-visitors-to-uk-tourism-rose-2-per-cent-in-july

(7) http://pdf.euro.savills.co.uk/uk/commercial-retail-uk/the-impact-on-the-uk-retail-market-21-july-2016.pdf

(8) http://www.independent.co.uk/news/business/news/oxford-street-shop-rents-shattered-by-record-deal-with-spanish-retailer-2058627.html

(9) http://www.propertyweek.com/news/oxford-properties-and-richemont-buy-new-bond-street-property-for-%C2%A3198m/5085320.article

(10) https://kfcontent.blob.core.windows.net/research/103/documents/en/q3-2016-4074.pdf

(11) http://www.colliers.com/-/media/files/emea/uk/research/research%20and%20forecasting/201609_reifq3.pdf?la=en-GB

Do Motivational Posters actually help increase Productivity in the Workplace?

You might find motivational posters in offices, cubicles and workplace walls. From quirky to dramatic, these posters are meant to inspire employees and encourage them to be more productive. Motivational posters also do more than just inspire. Their ultimate goal is to make employees feel interested in completing projects or achieving goals and objectives, thereby boosting productivity. That is the theory at least. But do they actually work?

Often, posters that work best are ones with interesting and thought-provoking designs. Posters that relate to your business are also typically more effective than generic ones. If you do want to have motivation posters in your workplace, you might want to ask employees to design their own as a team building exercise. Alternatively, you can ask a professional designer to create posters that align with your company’s values and branding.

In many cases, motivational posters don’t increase productivity. Dean Burnett, a neuroscientist and author, notes that it really isn’t possible to know where and when these types of posters are effective. Burnett argues that the most motivated employees are the ones that feel independent and autonomous. Plastering an office with overbearing posters that supposedly inspire with motivational quotes and stirring photographs may have the opposite effect. It might make employees feel like they are being micromanaged or pestered about being more productive.

Research into how workplace posters have impacted productivity and success has been lacking, but there is some evidence the supports the argument that motivational posters may not always work. A study undertaken by Maastricht University in the Netherlands found that some motivational posters don’t resonate with audiences that are unable to relate to what is being communicated. Specifically, tales about athletes who are ready to give up but find the inner strength to succeed might inspire other exhausted athletes but have the opposite effect on those of us that aren’t athletic or people who haven’t exerted themselves in the same way or less athletic. Continue reading “Do Motivational Posters actually help increase Productivity in the Workplace?”

Overview of the London Commercial Property Market – 2nd Quarter 2016

The London commercial property market started the year with moderate rental growth levels and a slight decrease in investment levels. As expected, the second quarter of the year has been marked by the results of the EU referendum vote, which has had a direct effect over the property market creating a rather volatile situation in most property sub-markets, but especially in those with high levels of foreign activity, such as London.

Although there seems to be no agreement on the long-term effect of the uncertainty caused by the referendum results, most analysts agree that a weaker pound may attract foreign investors who want to add to their portfolio by acquiring commercial properties in London while the exchange rates are favourable. See below for a detailed report on the latest trends affecting the London commercial property market during the past 3 months.

Office Market

During the second quarter of 2016, monthly office take up rates were just under 1 million square feet, below the past decade’s historical average (1.1 million). May was the best month for the office market, with over 900,000 square feet of office space taken up. There were virtually no changes in availability rates, and according to researchers at CBRE, 12.9 million square feet are currently available in the British capital.

Post-EU referendum uncertainty has affected the office market, as a number of prospective investors have put enquiries on hold, while others who already own office properties in London are debating whether they will move their operations elsewhere. Rental value growth has been directly affected by these events, as growth rates have dropped to their lowest index of the past 3 years in areas like Midtown and the West End. Continue reading “Overview of the London Commercial Property Market – 2nd Quarter 2016”